Published on Jan. 14, 2021
Go homeBenford's Law and Covid 19
In this post I applied Benford's law to a covid 19 data set.
If you have never heard about Benford's law check out the Wikipedia page.
In summary Benford's law describes the distribution of the first digit of a set of numbers.
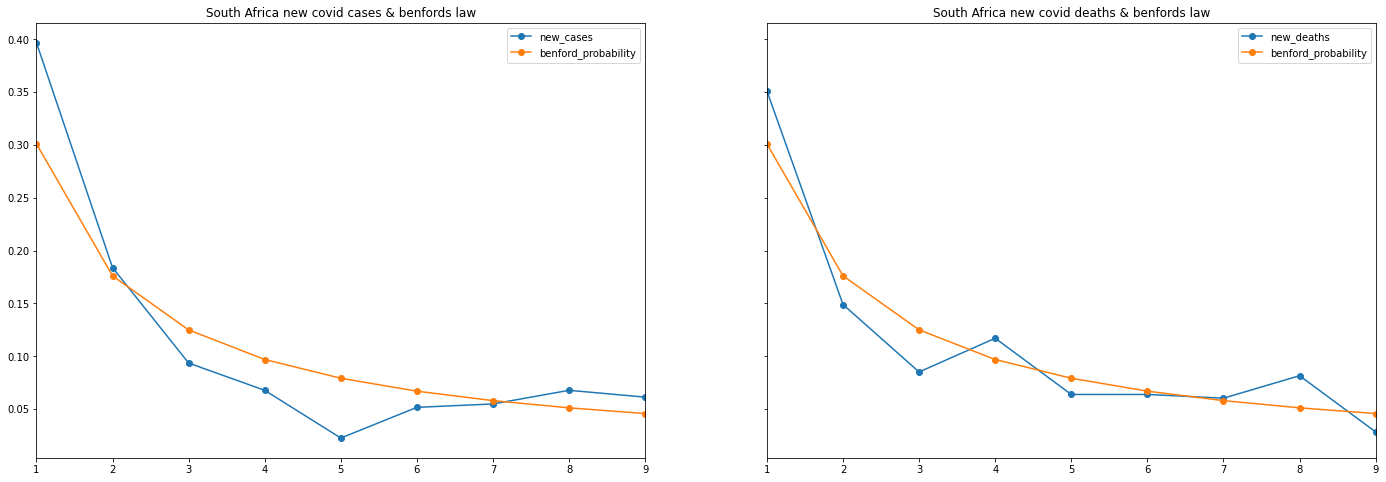
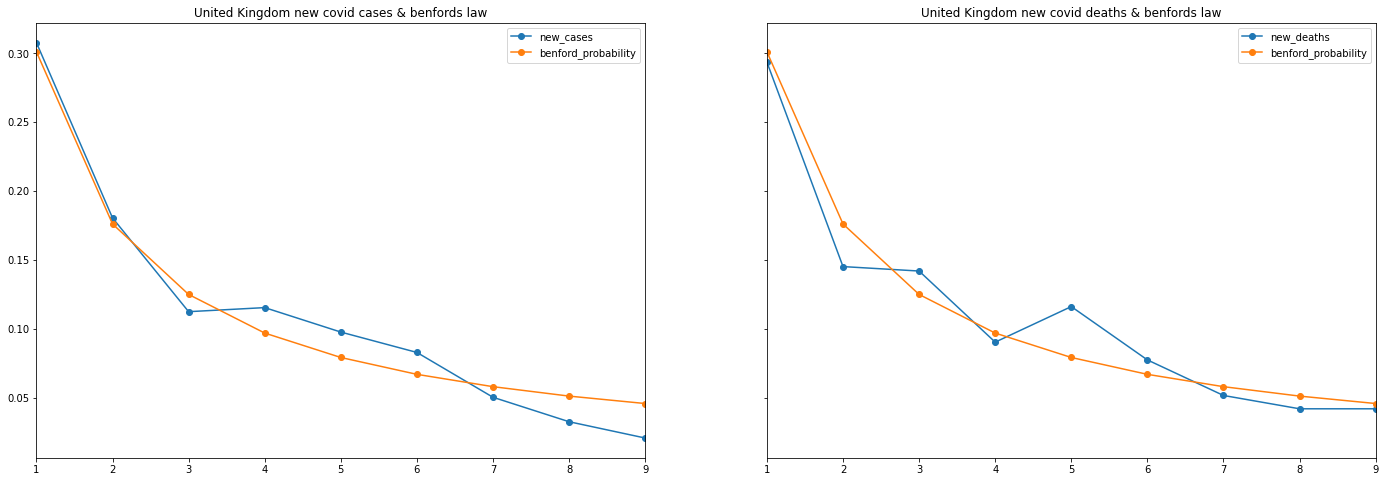
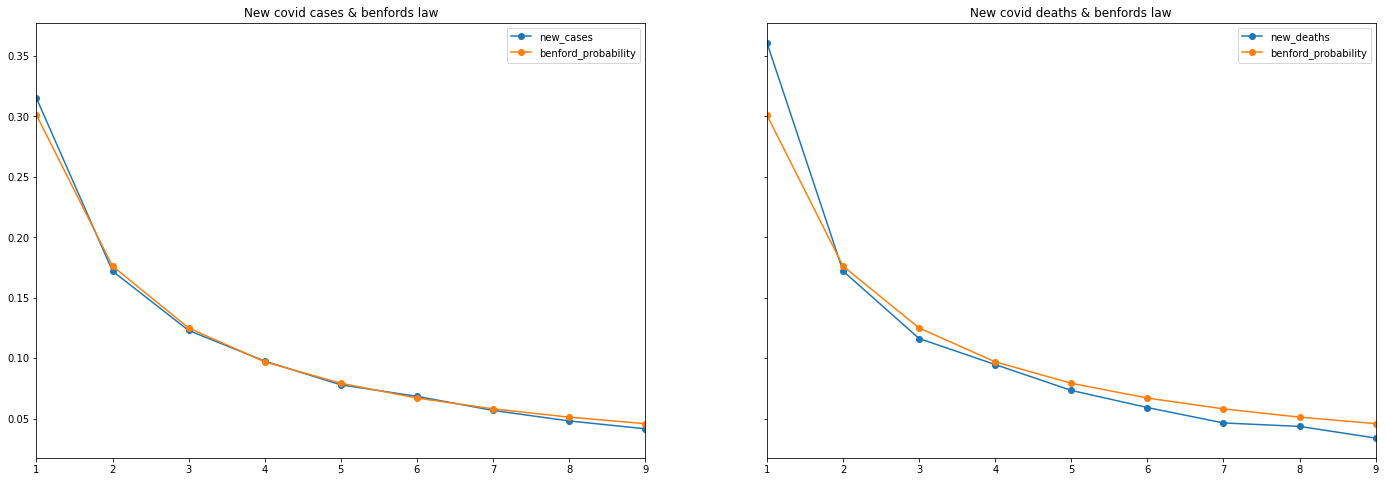
Within this distribution the leading digit is more likely to be small i.e. close to 1. I downloaded a set of COVID 19 data which includes the daily new cases and deaths per country. Given this data I plotted the frequency of the leading digit for South Africa and the UK as well as for all countries to produce these charts.


It looks like the new cases and deaths numbers adhere to the same distribution. I imagine as the number of observations per country grows each will tend towards the distribution.